Investing | Equity markets at ‘all-time highs’…

The importance of perspective and analytics
What happens to equity markets when they achieve an all-time high?
This topic arises periodically as a focal point of attention, more so for global media, as evidenced by headlines such as “World stock prices teetered near record highs…” Australian Associated Press June 9, 2021.
As with this particular headline and indeed many others, the operative word “teetered” – meaning ‘to balance unsteadily, usually before a fall’ carries a strong inference that investors should be very wary, particularly amidst a global pandemic and with interest rates about as low as they can go.
The natural instinctive response among readers to stories like this is one of anxiety, resulting in many feeling overwhelmed, choosing not to invest at all, instead waiting for that all elusive, ‘right time’ to invest.
Whilst doing nothing may serve to provide short term comfort of protection against market volatility, without a clear framework for understanding risk and historical returns – speculating on long term investment markets with a short term mindset can be a recipe for disaster.
So how often does the Sharemarket achieve an all-time high?
As investment markets have a positive expected return, intuitively it follows that they should also attain higher levels through time. Importantly however – earnings (including company profits, property rent and interest rates) are subject to random, unexpected changes from time to time, which in turn leads to price volatility – sometimes extreme, such as that witnessed in March 2020 when share prices fell by ~-40% within a month across the globe.
In setting expectations for future returns, it is crucial to be aware of the range of returns that are reasonable to expect. Many investors focus on the long term “average” and form a relatively simple expectation that this will be their normal experience from year to year.
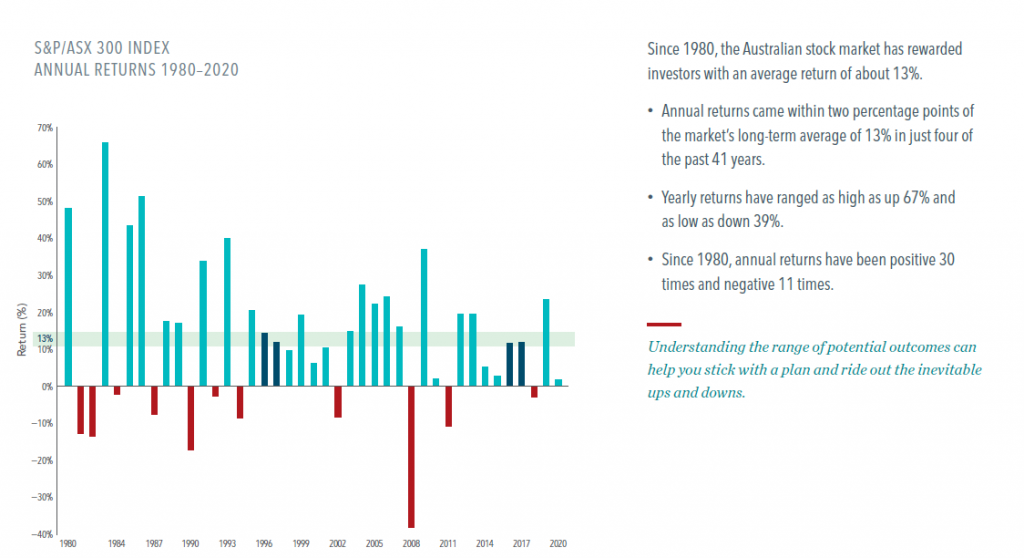
In reality, when we step back and look over longer periods, such as that since 1980 in the Australian Sharemarket (as per the following chart) we observe that the “average”, is not a particularly useful measure in the short term, occurring very infrequently in any given year.
During this time period, 11 of the 41 calendar years were negative returns and 30 were positive. Whilst the average annual return over the entire period was ~+13%, the average return itself was achieved on only 4 / 41 occasions – about 10% of the time.
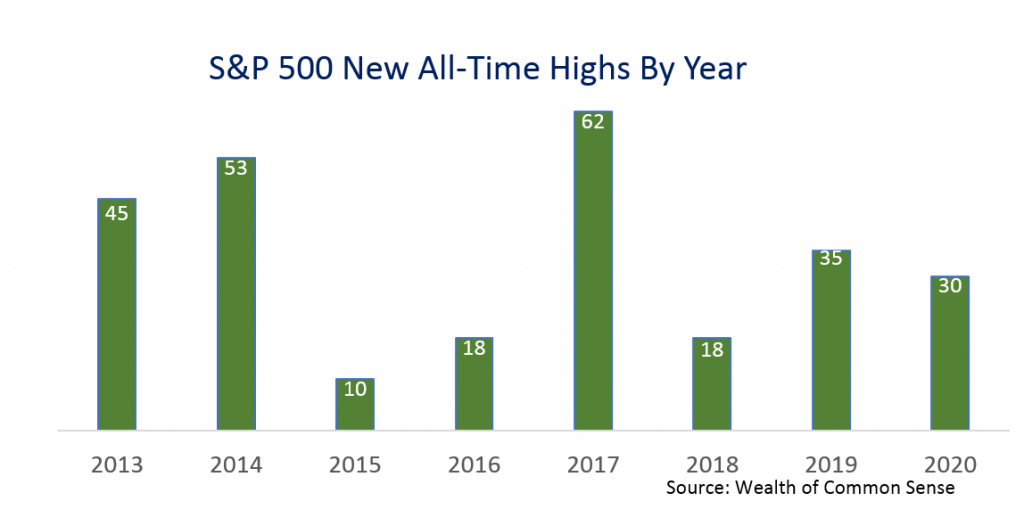
In contrast, the frequency of all time market highs – is far more prevalent.
As highlighted in the following chart from US analyst Ben Carlson which shows the US S&P 500 (dividends reinvested), there were 30 all-time highs in the 2020 calendar year alone.
Historically, what happens after the markets have achieved all-time highs?
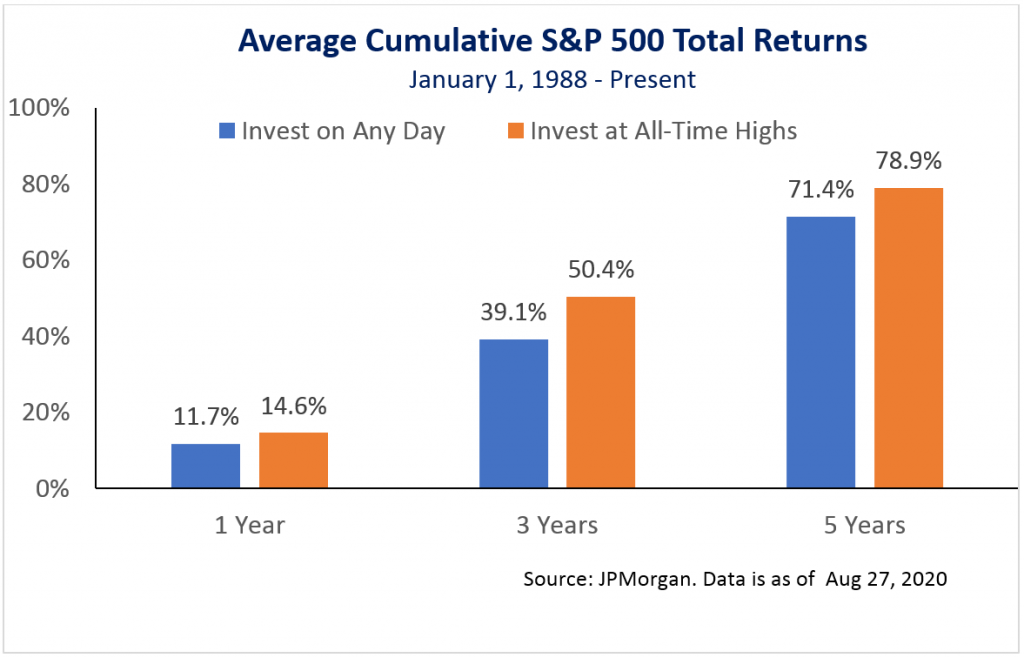
The chart below from JPMorgan, going back more than 30 years, looks at cumulative returns in the US market over 1, 3 and 5 year periods, assuming investing (i) on any given day and (ii) only immediately after an all-time market high.
In the scenario where an investment was made on any given day (reinvesting all dividends), the investment was positive in the first 1 year period +83% of the time and achieved an average return of +11.7%. As can be observed below in the blue bars, the results remained positive and improved over 3 and 5 year periods.
A perhaps surprising result (which might be attributed to confidence and momentum) was that by investing only on days when the market closed at an all-time high, the results were even better. In fact, returns were positive +88% of the time with an average total return of +14.6% for any 1 year period and again, over 3 and 5 year periods, the numbers were even higher.
Whilst the above charts may not provide support for a relationship between future poor returns and investing when market indexes are at record highs – it is worth noting that when markets generate exceptionally strong short term returns (i.e. >+50%) within a 12 month period, and the subsequent 12 month period of returns.
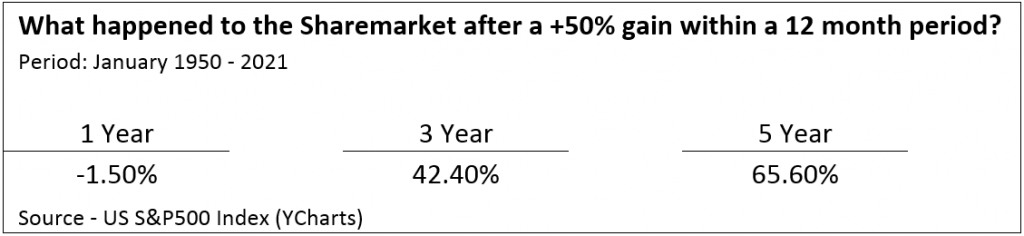
As can be seen in the table above, the 1 year returns following very large gains were slightly negative.
As with most long-term market averages, there was a wide range of results here. Approximately 25% of 1 year periods saw double-digit gains while 20% of the time there were double-digit losses. So even though on average returns were negative in the following period, it is certainly not a foregone conclusion that this scenario repeats with any great consistency.
More importantly than the immediate 12 months post a significant gain, is the return for the medium to longer period thereafter. In this regard, the longer the timeframe the stronger the returns. Of note – there was not a single 3 year period following a 12 month gain of +50% or more that showed a negative return and there was only 1 single 5 year period with a loss and that came at the tail end of the market crash of 2000-2002 that saw the market fall -50%. For the entire period since 1950, the annual average returns for 3 and 5 years were +7% and +11% respectively (before dividends).
In conclusion, if economies are growing and companies are finding new more productive ways to generate wealth, using new technologies and other innovations, you should expect the share market to rise over time. That is simply what it does.
What Have We Learnt?
Whilst it is always important to be vigilant, an investor’s first reference should not be to the prevailing level of the equity markets, as represented by a single index in a single market, but to the asset allocation and level of diversification chosen to suit personal risk preferences, goals and time horizon. The fact of equity markets reaching all-time highs is that it is not unusual and should be anticipated.
We have also seen that markets achieve this result often, despite many underlying company prices not moving in lockstep – which is also relatively normal and demonstrates the challenges of taking a narrow and concentrated approach to security selection in forming an investment portfolio. Sector leadership (i.e. market composition) constantly changes as well, based on news on the economy, government policy, technological innovation and a host of other influences.
History suggests there is a positive return from investing in equities, even at record levels over reasonable periods of time and that the longer the period of investment post periods of significant gains, the greater the likelihood of continued positive returns. Correspondingly, over shorter time periods investors should expect a wide dispersion of possible outcomes, both favourable and adverse.
This also highlights the crucial importance of considering one’s intended timing with regard to withdrawing from an investment portfolio (either by choosing not to reinvest dividends and distributions, and/or selling down selected investment holdings). This simple analysis provides far greater informational value when making investment decisions than whether financial markets have recently reached a new zenith.
It is noteworthy that if there is no intention of selling investments at their current prices then the value of your investment portfolio is somewhat of an abstract concept and should be of lesser importance that what the value will likely be at the point in time when you do intend to sell.
Despite media chatter about stocks “experiencing vertigo” or “teetering at unprecedented highs”, it is too simplistic to draw implications about future poor performance from current market levels. Stock markets do not go up in straight lines. We do know, however, that they rise over time and there is a positive return on capital. If there weren’t, no-one would invest in the first place.
A measured response is to stick to one’s chosen plan, diversify broadly, stay focused on what you can control and periodically rebalance your portfolio to reflect your own risk appetite, circumstances, goals and time horizon. In the case of new investors, commencing the investment process is key, however to manage the natural human emotion of intolerance to volatile markets, progressively investing over 6-12 months with periodic review is a prudent approach.
These are the prescriptions we have adopted at APW which we think make sense for everyone.