Should investors engage in Market Timing to avoid a Sharemarket Correction?

With the continuous run of growth in global share markets since the lows of March 2020, (fuelled at least in part by accommodative fiscal and monetary policies) a reasonable question is whether we are due for a market correction (where the index falls > -10%), particularly as interest rates start to rise in the coming years. Similarly, related questions include whether it is best to remain invested – or whether it’s better to try and avoid such downward volatility, by ‘sitting on the side-lines’ for a period, then investing again at a later point in time.
Consider the US share market for example (chart below), which has experienced a +104% gain since the absolute low of 23rd March 2020, without any period of decline exceeding a -5% adjustment for the past 18 months.
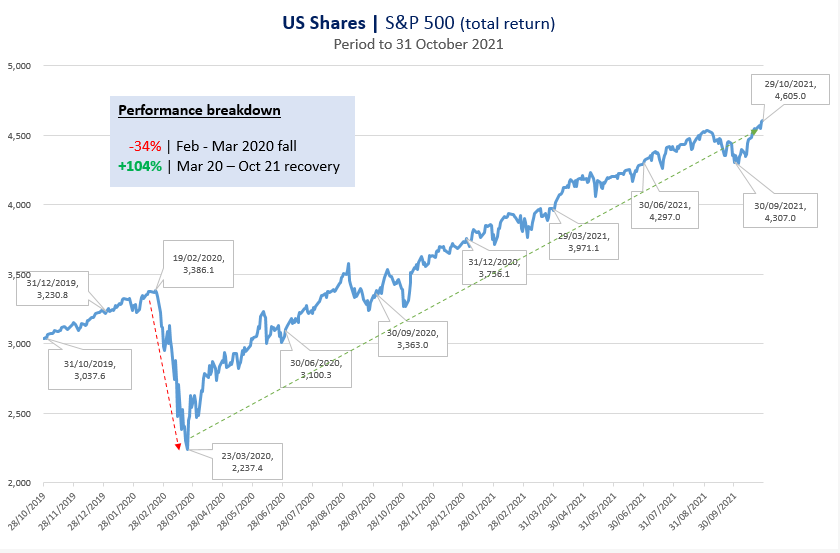
With market corrections there are at least 2 things we know for certain; (i) a prudent investment strategy should anticipate that they will inevitably occur over a period of time and (ii) the average size and rapidity of positive returns achieved in the aftermath of market corrections are also important questions to be considered in making investment decisions.
The classic one-liner “It’s difficult to make predictions – especially about the future” has been humorously attributed to a number of people through history. Whilst acknowledging the inherent difficulty in trying to predict the precise timing of a market correction and the potentially significant cost of forecasting error, it is completely understandable that investors fear losing money (even though it may only be a ‘paper loss’ provided they choose to remain invested).
Fortunately, there is a significant body of historical evidence for the proposition that market timing is not an essential element to achieving a successful long term investment experience, despite the short term setbacks that arise along the journey.
Taking this a step further, we consider that based on the evidence, market timing strategies are extraordinarily dangerous, failing more often than not as a result of speculating on the unknowable short term movements in asset prices and ultimately counterproductive to the best interest of investors, particularly after allowing for taxes and transaction costs.
In the table below (Report 1a), global research firm – Standard and Poors (S&P) has compiled analysis of the returns achieved by actively traded / market timing strategies – compared to the passive benchmarks for each of the major investment categories. This analysis forms part of a half yearly report entitled the SPIVA (S&P Index vs Active) Scorecard, originating from the first US publication in 2002 and cataloguing a recurring global theme since that time.
For example, 936 Australian equity strategies (including REITs – i.e. listed property), 500 international, and 109 Australian bond funds formed the basis of the 2020/21 study.
Of particular note is the inability of the ‘active’ strategies to outperform their passive benchmarks – (which assume maintaining a buy/hold approach) – most often holding similar securities to those which the active managers attempt to trade in and out of, with the aim to buy low and sell high repeatedly.
Of note;
- ~78% – 95% of active market timing strategies have underperformed their respective index benchmarks over 10 and 15 year periods
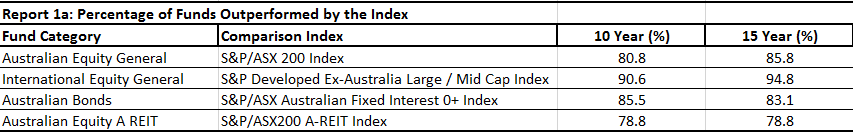
Whilst it is clearly extremely difficult to consistently apply an active timing strategy that outperforms the broader market over time, the above table does highlight that a small proportion of investment managers did manage to achieve this feat over a reasonably long time frame, which includes the challenges arising from the GFC and the global pandemic.
The obvious question follows – can the limited number of outperforming ‘active strategies’ maintain their relative outperformance moving forward, or put another way – do the investment managers that employ these strategies exhibit persistence in their outperformance that would induce us to engage them?
Again, this important question has been the subject of longstanding research into what the evidence actually shows. In parallel to S&P Performance Scorecard is analysis that focusses specifically on this issue, reflected in the S&P Persistence Scorecard. The report examines the performance of active strategies that had previously outperformed their benchmarks for a period to identify whether they continued to outperform in subsequent periods.
Consider the following table that analysed strategies from 2016-2020;
- 81 of the 179 active strategies outperformed their Australian Sharemarket benchmark in 2016*
- 1 year later in 2017, of the 81 strategies, only 45.7% outperformed
- 4 years later in 2020, of the 81 strategies, only 1.2% outperformed
* Whilst this may seem remarkably high (around 45%), looked at another way it suggests that the prospect of success is not significantly different to the odds of a coin toss.
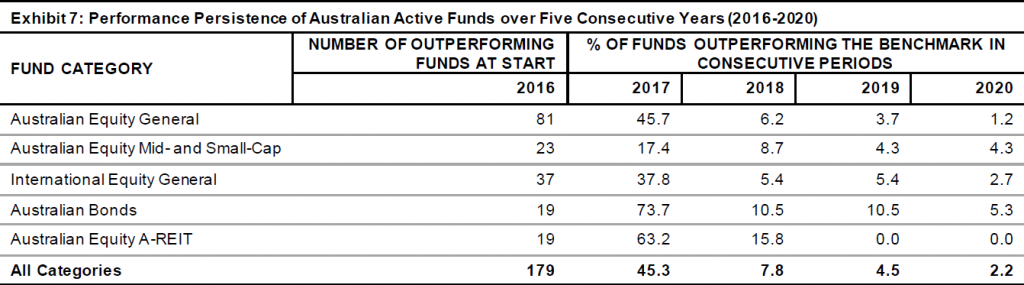
The stark conclusion is that only a minority of Australian higher performing investment funds persisted in outperforming their respective benchmarks over 3 – 5 consecutive years by adopting active market timing and security selection strategies, rather than using a disciplined long term buy and hold strategy that broadly disregards the distractions arising from short term price movements.
Incidence of Corrections
Just as it is important for an investment strategy to contemplate the normal occurrence of adverse market corrections over time, it is equally as critical to recognise the typical market outcomes following such events.
As highlighted in the table below, the typical recovery that transpires post a > -10%, -15% or -25% market decline – over the ensuing 1, 3, 5 year periods is often the best time to be invested for those with a long term investment perspective.
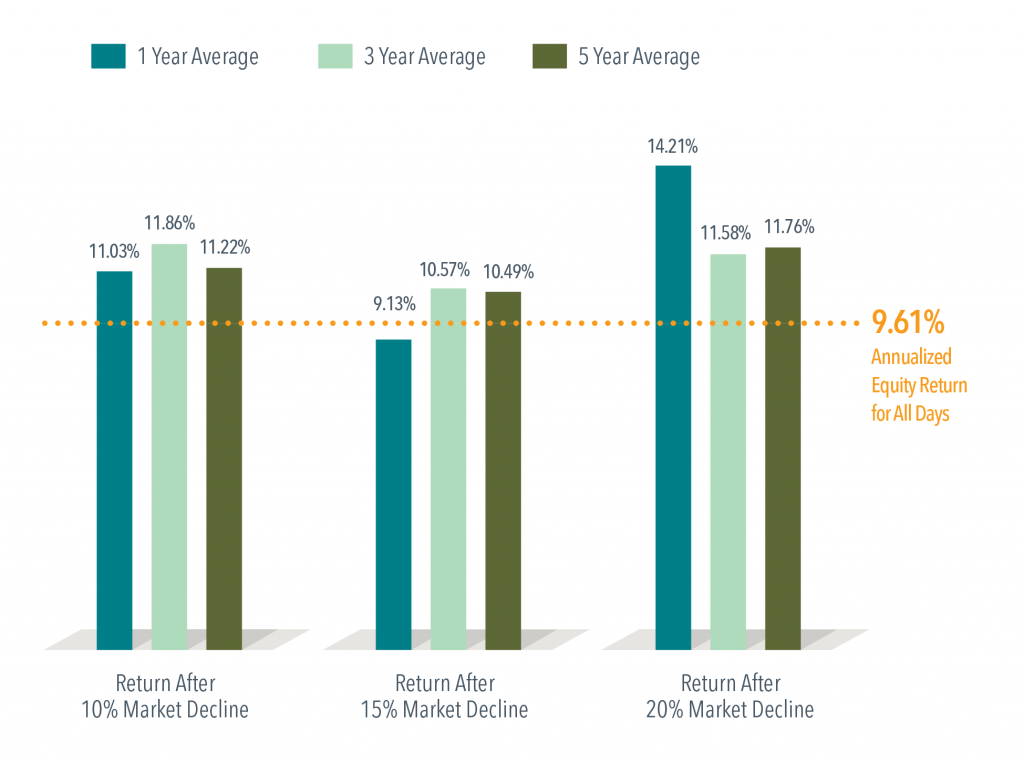
Data: Fama-French Total US Market Research Index.
Period: July 1926 – December 2019
In closing, it is vital to recognise that short term Market Corrections are an inevitable part of the investment experience. The key is to ensure your portfolio and investment strategy has been designed with this in mind and to differentiate between short term unrealised losses and real, long term gains.
Disclosure & Disclaimer
This material is provided for information only.
No account has been taken of the objectives, financial situation, or needs of any particular person. Accordingly, to the extent this material constitutes general financial product advice, investors should, before acting on the advice, consider the appropriateness of the advice, having regard to the investor’s objectives, financial situation, and needs.
This is not an offer or recommendation to buy or sell securities or other financial products, nor a solicitation for deposits or other business, whether directly or indirectly. Any opinions expressed in this publication reflect our judgment at the date of publication and are subject to change.
Index data has been provided by MSCI, UBS, S&P/ASX, Bank of America/Merrill Lynch, Barclays, Citigroup and Russell Investment Group, and is subject to copyright. Indices are not available for direct investment. Importantly the reported performance does not reflect the expenses associated with the management of an actual portfolio.